See the macro picture in seconds.
Your command center for economic health. Track key leading indicators, gauge composite momentum, and contextualize current data against historical recession cycles—all in one dashboard.
See Leading Indicators in Action
Watch how to move from a sea of raw economic data to a clear warning signal — in seconds.
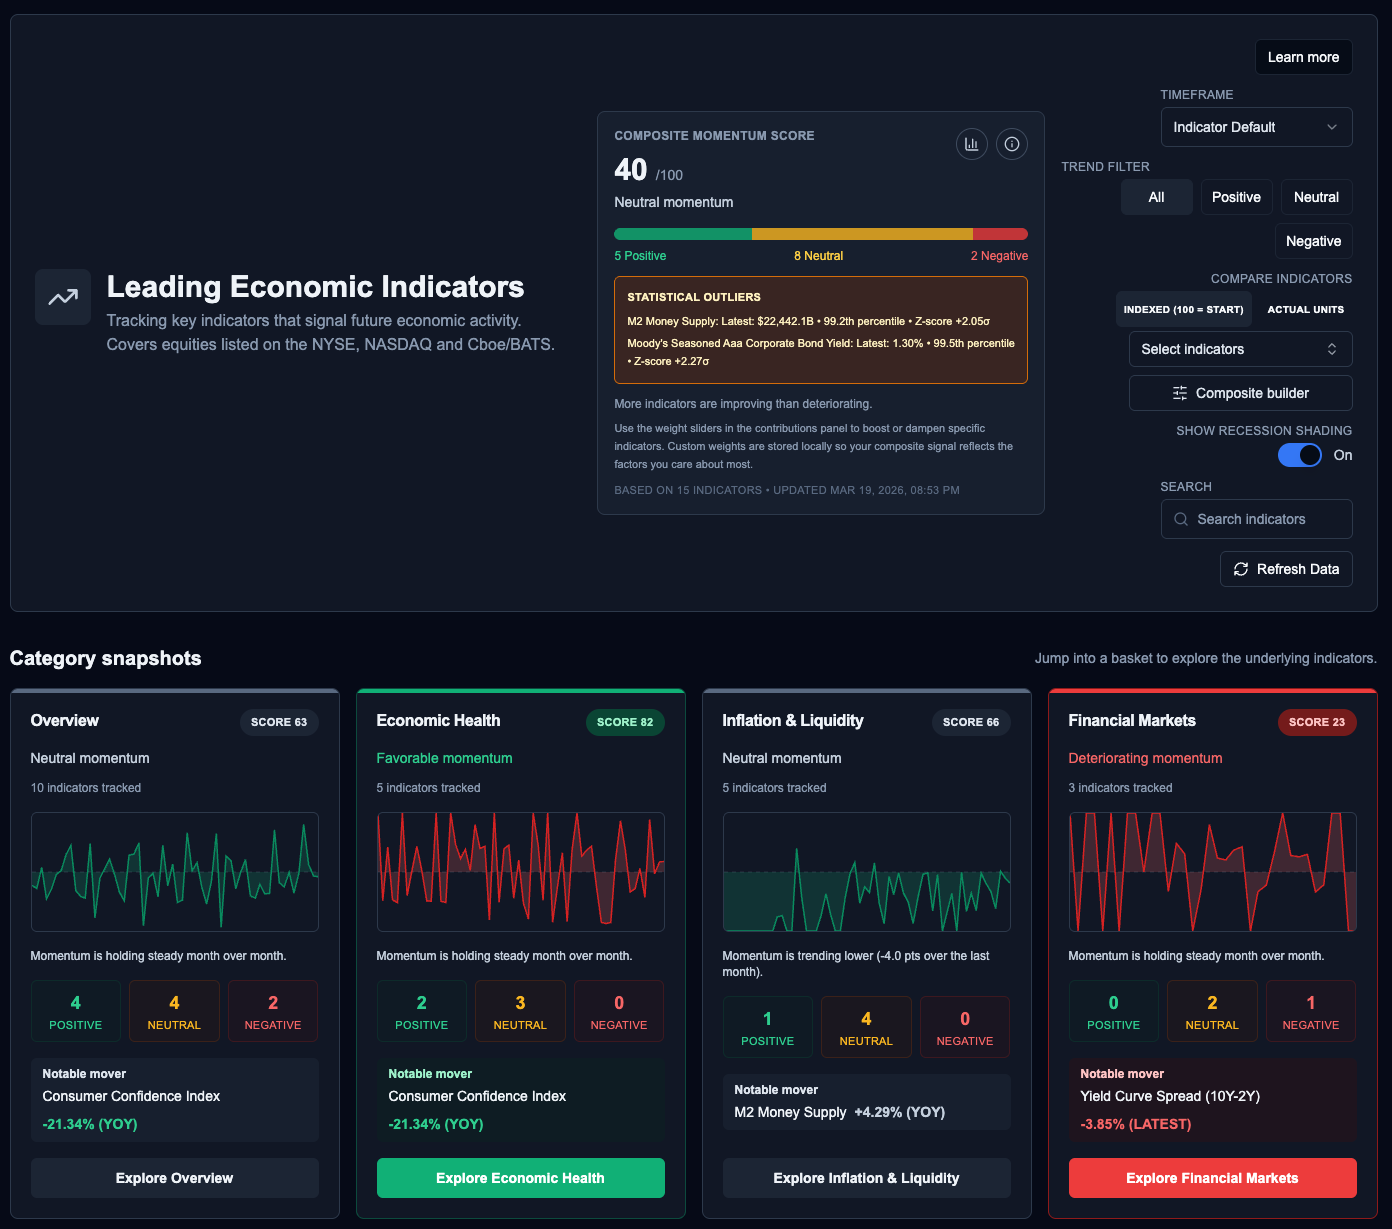
Composite Momentum Scoring
Stop guessing about the overall direction of the economy. Our system tracks 15+ key indicators and synthesizes them into a single, breadth-weighted momentum score (0-100) across categories like Economic Health and Inflation.
- Breadth-weighted scoring (0-100)
- 15+ critical indicators tracked
- Category-level breakdowns
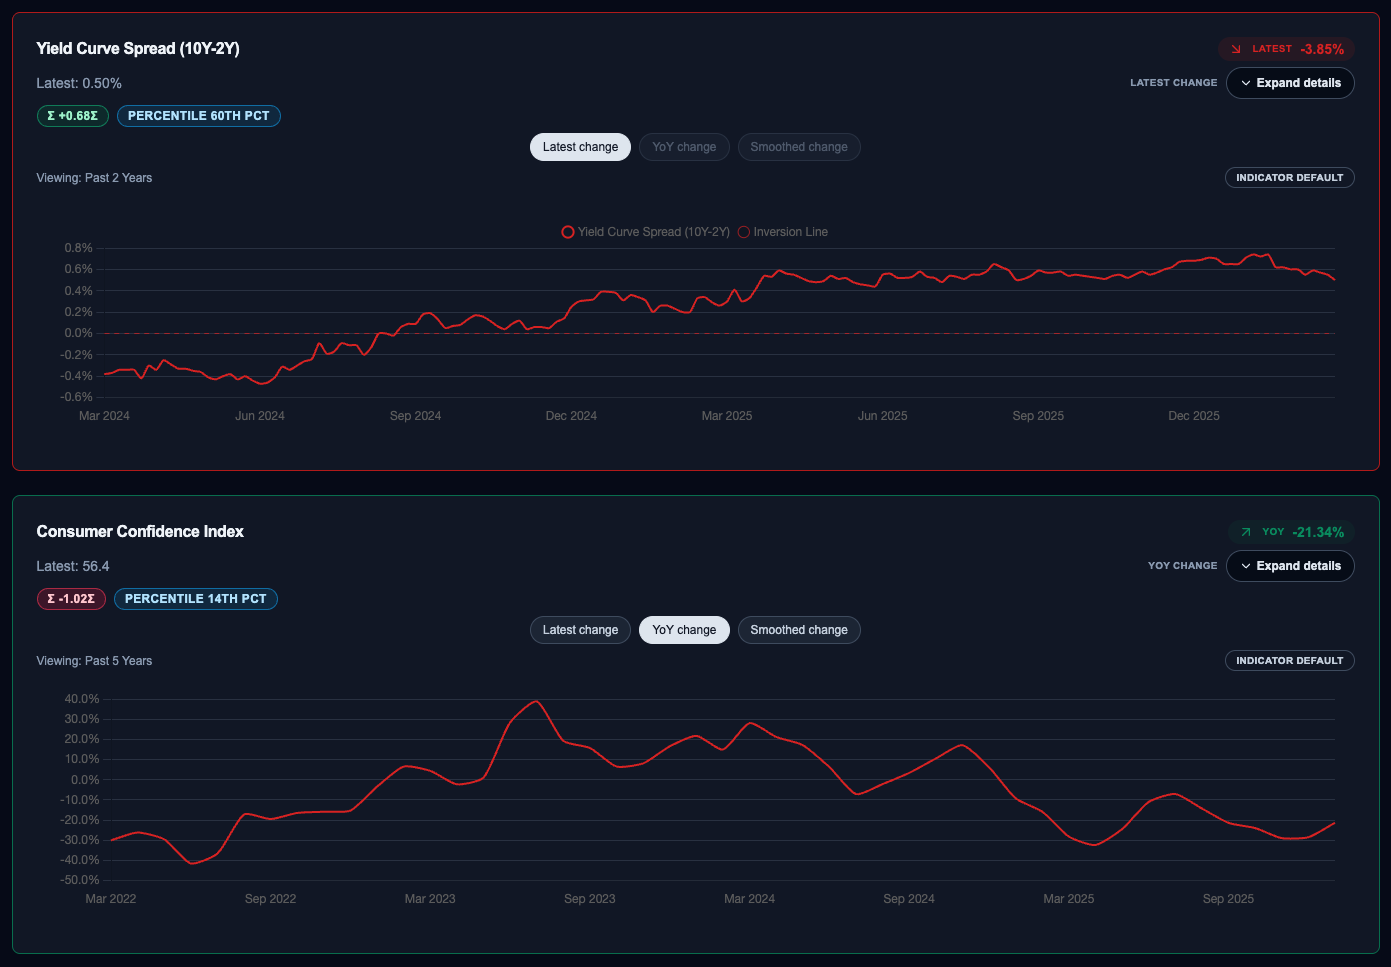
Statistical Outlier Detection
Cut through the noise. We automatically flag indicators that are standard deviations away from their historical norms, complete with exact percentile rankings and year-over-year change metrics.
- Standard deviation scoring (Sigma)
- Historical percentile rankings
- Year-over-year change highlights
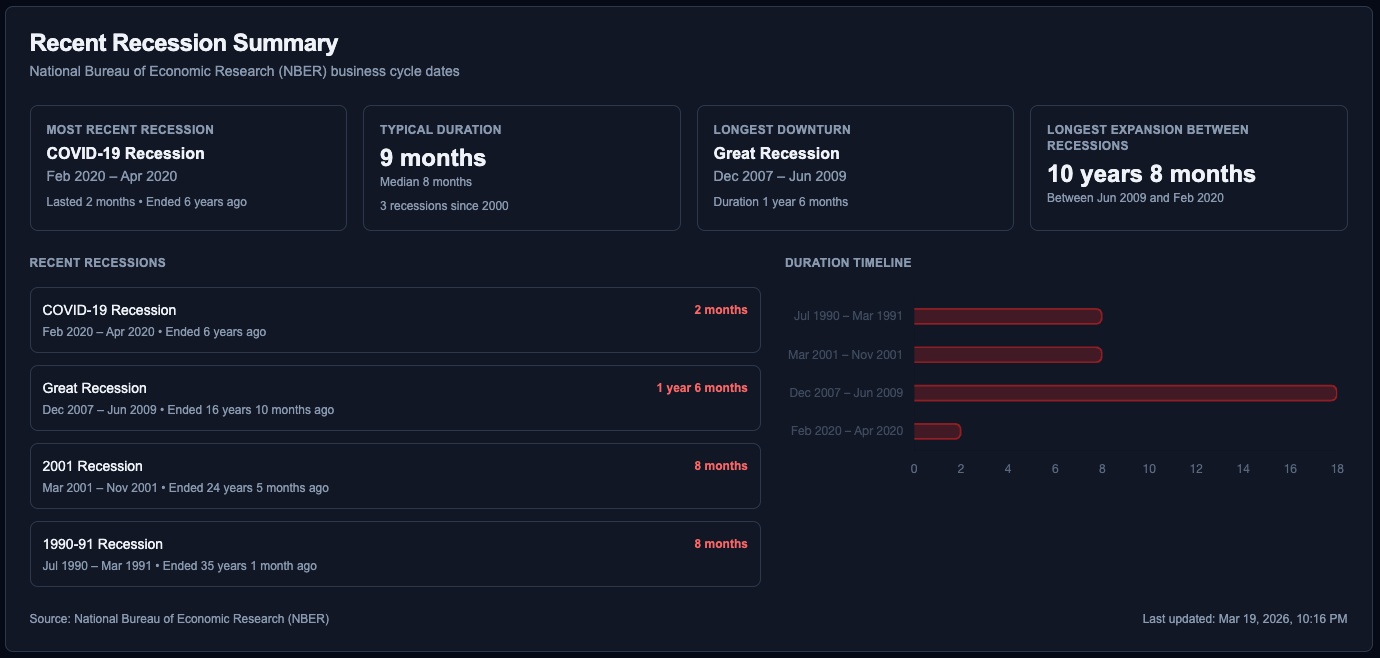
Historical Recession Context
Understand today's data by looking at yesterday's crises. Overlay any indicator against official NBER recession periods—from the dot-com bust to the Great Recession—to evaluate current macroeconomic risk.
- NBER business cycle overlays
- Historical duration tracking
- Expansion vs Contraction analysis
Built for Serious Market Participants
Tailored macroeconomic workflows for every style of investing.
Macro Investors
Align your portfolio with the broader business cycle before the rest of the market catches on to shifting trends.
Asset Allocators
Adjust equity and fixed-income exposure confidently based on objective score changes across Economic Health and Financial Markets.
Risk Managers
Monitor systemic risks and liquidity contraction warnings using historical percentile comparisons and NBER business cycle context.
Trusted by macro investors. Adopted by asset allocators.
Join thousands of traders replacing multiple tabs and disparate tools with one unified macroeconomic workspace.
Read Stories →"The multi-factor recommendation stack is incredible. Finally, a tool that weighs my technical breakout against the fundamental sentiment score simultaneously."
"Having pattern detection automatically overlay on my custom timeframes saves me easily two hours of manual prep work every morning."
"Our fund relies on the Monte Carlo risk logic embedded right next to the chart. The direction-aware volatility tracking prevents us from getting caught in false breakouts."
"The multi-factor recommendation stack is incredible. Finally, a tool that weighs my technical breakout against the fundamental sentiment score simultaneously."
Why switch to FinMonkeys?
"I used to spend hours checking multiple FRED tabs for economic data. Now it's all in one workspace."
"The real-time macro data combined with AI insights give me a massive edge in live workflows."
Common Questions
What economic indicators are tracked?
We track over 15 core macroeconomic indicators including Nonfarm Payrolls, M2 Money Supply, Corporate Bond Yields, and Consumer Confidence.
How does the Composite Momentum Score work?
Our engine synthesizes 15+ indicators, measuring breadth and magnitude of change, to provide a single score indicating overall economic expansion or contraction.
Can I use this for live intraday trading?
Yes. The platform supports live workflows with auto-refresh controls gated intelligently to monitor market-open limits and forming candles.
Are statistical outliers automatically detected?
Absolutely. The system continually scans all tracked data to flag indicators that are standard deviations away from their historical norms.
Ready to step back and see the macro picture?
Join thousands going from raw data to economic context in seconds with FinMonkeys.