"I used to spend an hour every morning scanning EDGAR for relevant events. Now Catalyst Radar does it for me before market open."
Never Miss a Market-Moving Filing Again.
Catalyst Radar scans SEC filings across the entire market in real time. Filter by type, impact score, and confidence — then instantly read AI-generated summaries of what each event means for price.
Start Monitoring →
Continuously monitoring SEC EDGAR filings
Powered by Real-Time SEC Filing Intelligence & AI
Monitor SEC Filings
Earnings & Guidance
Management Changes
M&A Activity
Legal & Regulatory Risk
AI-Powered Summaries
Price Reaction Tracking
Entity Extraction
Confidence Scoring
Monitor SEC Filings
Earnings & Guidance
Management Changes
M&A Activity
Legal & Regulatory Risk
AI-Powered Summaries
Price Reaction Tracking
Entity Extraction
Confidence Scoring
From Raw Filing to Actionable Catalyst
See how we collapse hours of SEC parsing into a 10-second briefing.
1
Monitor
Continuously scanning every SEC filing across all public companies — earnings, guidance, management changes, M&A, legal events, and more — the moment they hit EDGAR.
2
Score
Each catalyst is evaluated by AI for impact level, directional sentiment, and confidence — so you know exactly which events deserve your immediate attention.
3
Explain
Get a structured AI breakdown: a summary of the filing, key points extracted, item-by-item explanations, named entities, and linked source documents.
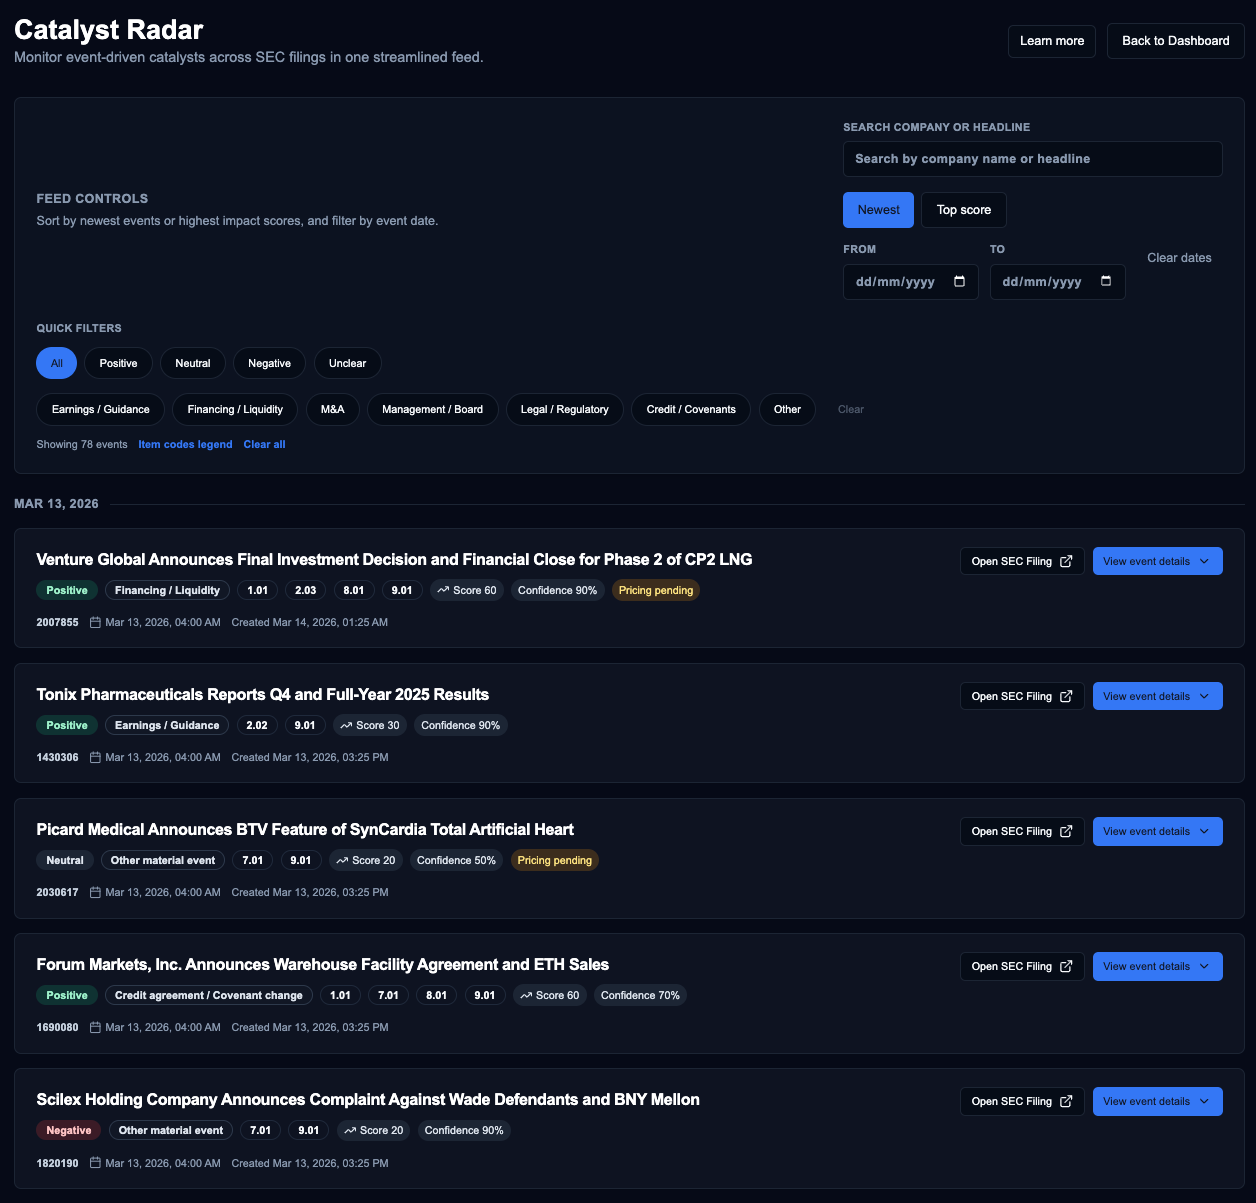
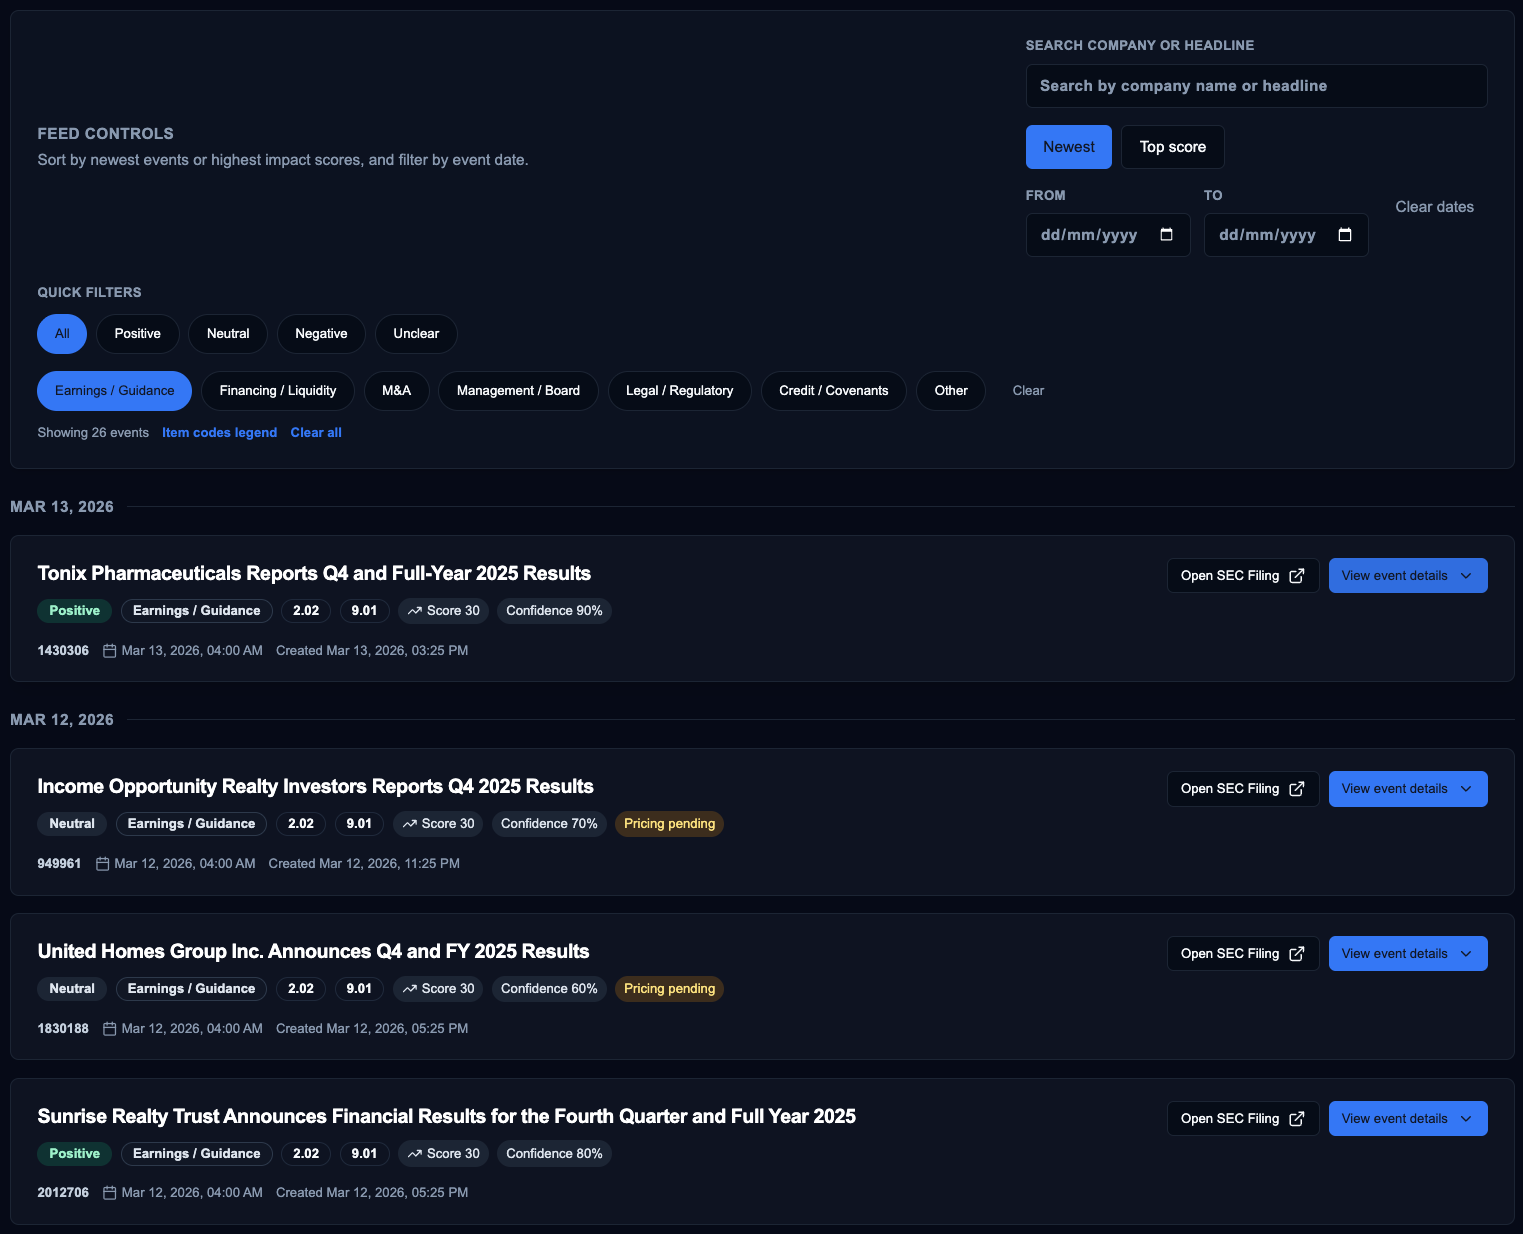
Your Entire Market Catalyst Feed — In One Place
Stop hunting across EDGAR and financial news sites. Catalyst Radar aggregates every material SEC filing into a single, sortable, filterable feed. Search by company, filter by catalyst type, set custom date ranges, and sort by highest-impact events — in real time.
- Filters by type: Earnings, M&A, Management, Legal & more
- Sort by impact score, recency, or confidence
- Search by company name or ticker
Score: 9.01
Confidence: 82%
Impact: Positive
🔍 Click to zoom
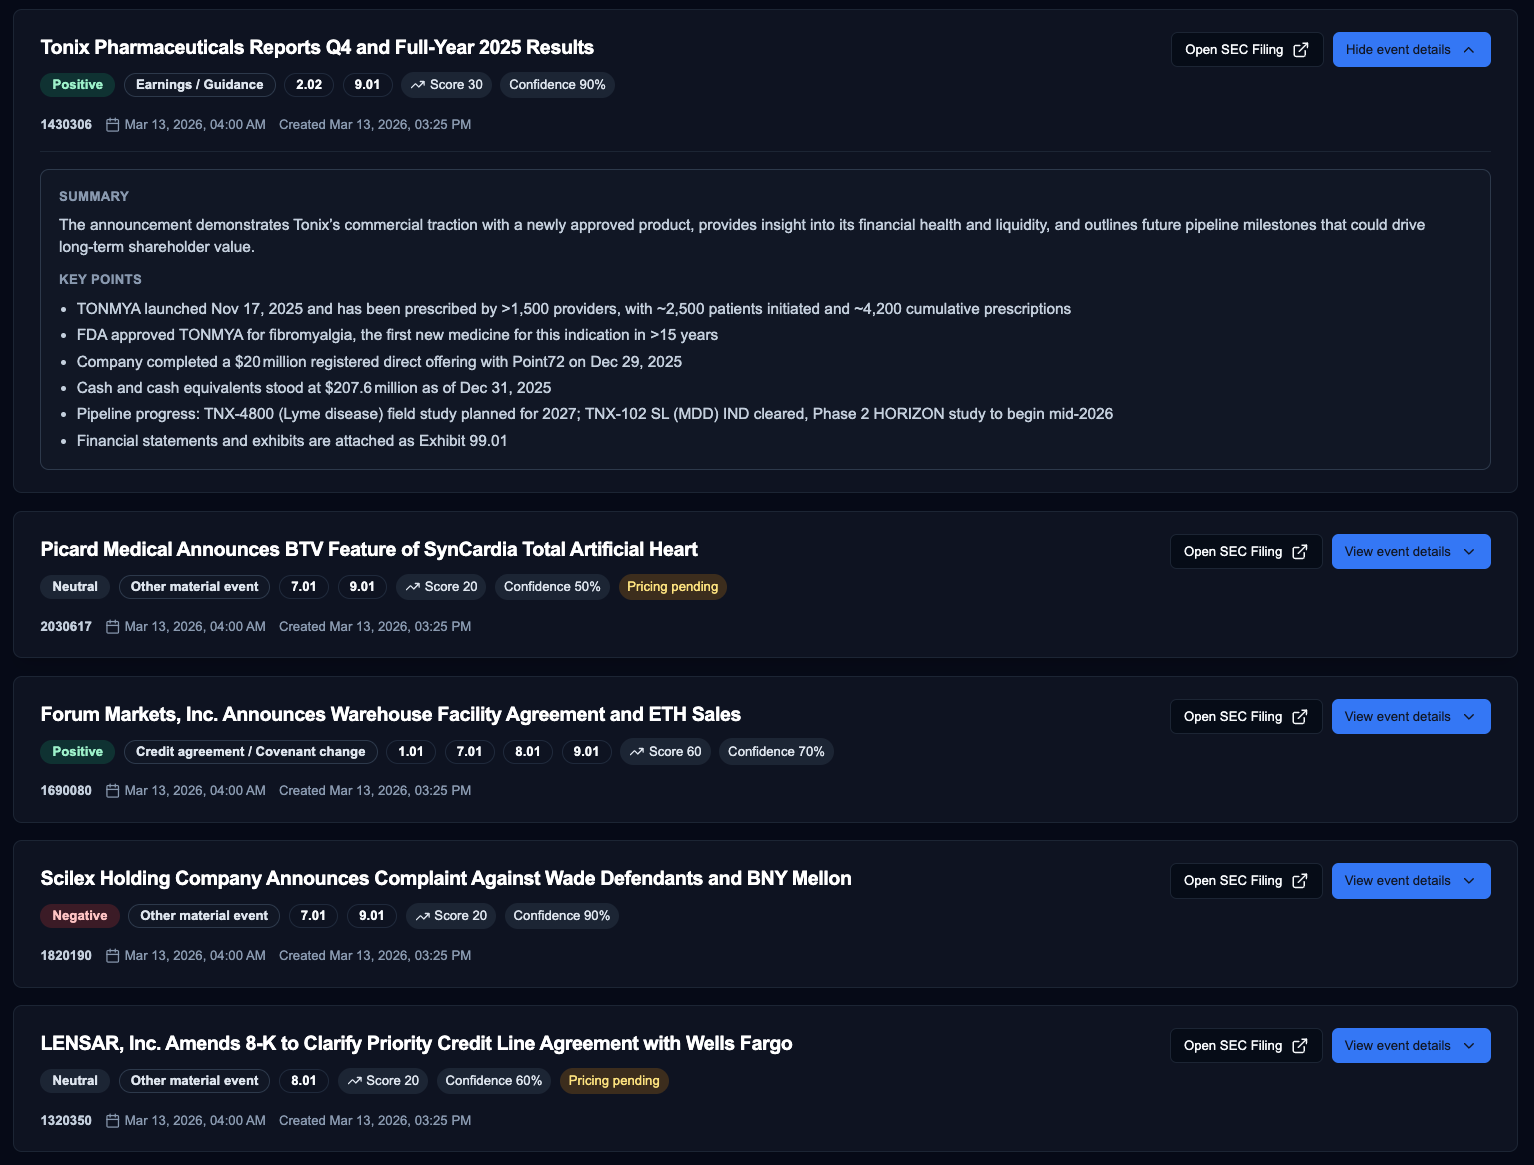
The Full Story Behind Every Filing
Click any catalyst and go deep instantly. Catalyst Radar breaks down each filing with an AI-generated summary, key points, item-by-item explanations mapped to specific SEC form sections, and all named entities extracted — leaving nothing to interpretation.
- AI summary + key bullet points
- Named entities: companies, people, roles
- Source links to original SEC filings
AI Summary: Generated
Key Points: 5 extracted
Entities: Angi Inc., CFO, Jeff Ng
🔍 Click to zoom
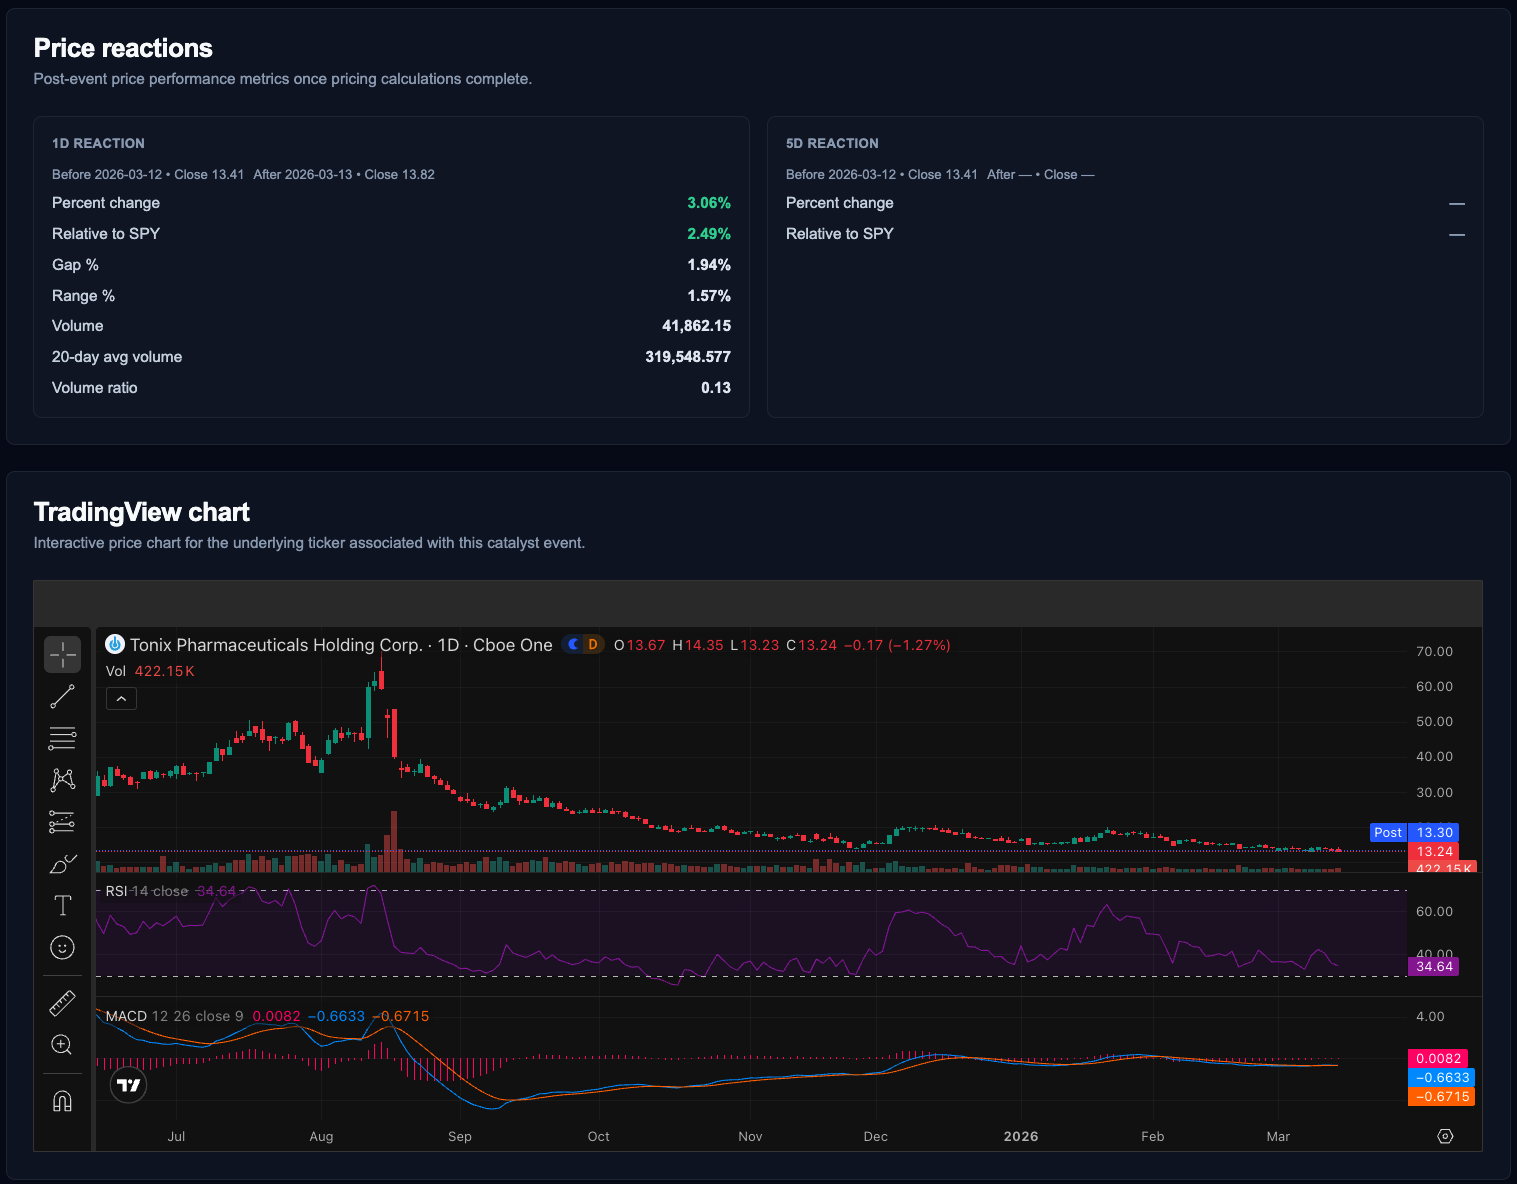
See the Price Impact. Trade the Catalyst.
Every catalyst event includes post-event price performance metrics — percent change, gap, volume ratio, and relative performance vs. SPY — calculated once pricing data is available. An embedded TradingView chart shows you the underlying stock price in full context.
- 1D and 5D post-event price reaction panels
- Gap %, volume vs. 30-day avg, and SPY relative performance
- Embedded interactive TradingView chart per ticker
1D Reaction: -4.82%
Volume Ratio: 0.65
Relative to SPY: -5.01%
🔍 Click to zoom
Stop Sifting. Start Reacting.
How Catalyst Radar transforms your event-driven research workflow.
The Old Way ❌
- Manually searching EDGAR for relevant filings
- Hours reading dense legal and financial disclosures
- Guessing whether an event is bullish or bearish
- No way to track post-event price performance
VS
The FinMonkeys Way
10 SECONDS
- One live, filtered feed across the entire market
- AI-generated summary and key points in seconds
- Clear impact score, sentiment, and confidence rating
- Built-in 1D/5D price reaction data per catalyst
Loved by traders. Trusted by research teams.
Join thousands of traders who rely on Catalyst Radar to be the first to know — and the first to act.
Read Stories →"
"I used to miss half the catalysts that moved my positions. Now I see every relevant SEC filing the moment it drops, with a confidence score telling me if it's worth acting on."
"
"The price reaction panels are what really sold me. Being able to see gap %, volume ratio, and SPY-relative performance all in one place saves me enormous time post-event."
"
"Our team uses Catalyst Radar to cross-reference all material filings for our coverage universe. The entity extraction and item explanations are genuinely research-grade."
"
"I used to miss half the catalysts that moved my positions. Now I see every relevant SEC filing the moment it drops, with a confidence score telling me if it's worth acting on."
Built for Event-Driven Market Participants
Precision intelligence for every player who lives and dies by catalysts.
Event-Driven Traders
Identify high-impact SEC catalysts the moment they drop and act before the market fully prices them in.
Fundamental Investors
Quickly surface earnings misses, management transitions, and M&A deals that change the long-term narrative for any company.
Research & Compliance Teams
Replace hours of EDGAR parsing with instant, structured AI breakdowns — complete with source links and entity maps.
Why users switched
"The confidence scores help me prioritize. I only dig deep on the events that actually matter."
Common Questions
Where does the filing data come from?
We pull directly from SEC EDGAR in real time, covering all public company filings including 8-K, 10-Q, 10-K, proxy statements, and more.
How is the impact score calculated?
Our AI evaluates each filing for materiality, directional sentiment, and probable price significance — then assigns an impact score from 1–10 and a confidence percentage.
Can I filter for specific catalyst types?
Yes. Filter by Earnings/Guidance, M&A, Management/Board Changes, Legal/Regulatory, and more — with custom date range pickers and ticker search.
When are price reaction metrics available?
Price reaction data (1D and 5D) is calculated and surfaced once post-event pricing data is fully available through our data pipeline.
Ready to catch every catalyst before the crowd?
Join thousands using FinMonkeys to monitor the full market's catalyst feed — in real time.
Start Monitoring
Free plan available. No credit card required.
Research Only. No Trading Executed.This tool provides AI-driven SEC filing analysis for research and informational purposes. All investment decisions remain yours. Always consult a qualified financial advisor.
×![Expanded feature preview]()