1
Chart & Overlays
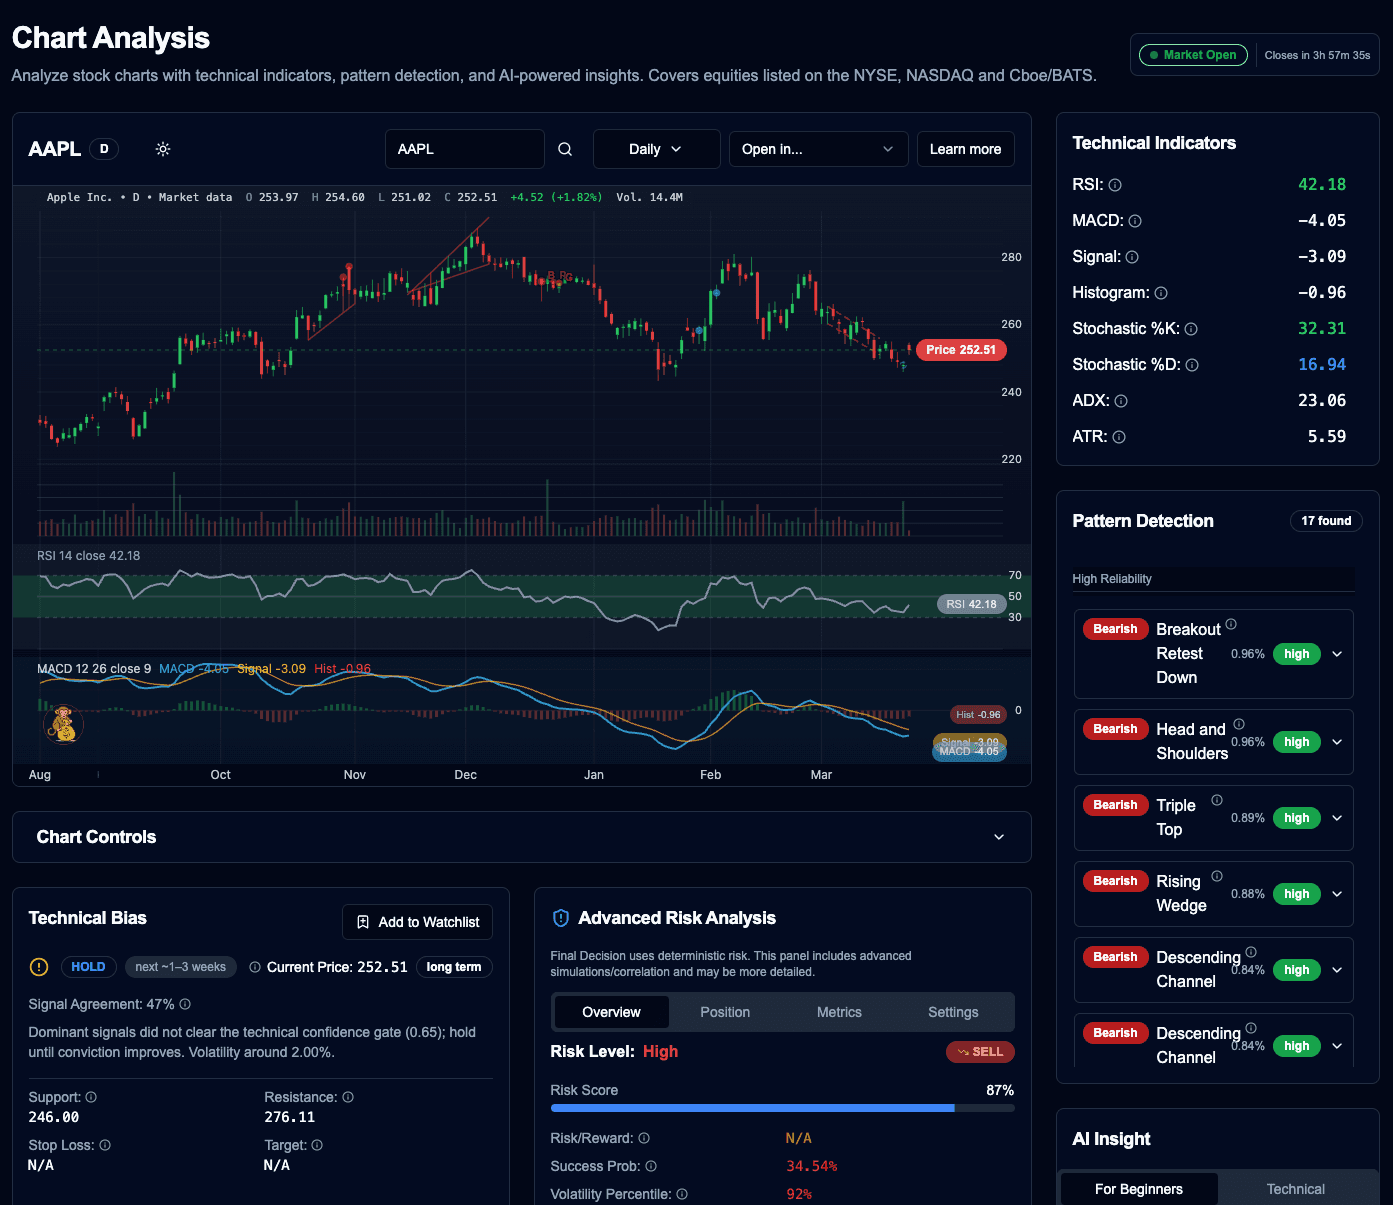
Pick a symbol and timeframe. Instantly overlay advanced indicators on our interactive canvas.
Your end-to-end technical analysis workspace. Combine interactive charting, automated pattern detection, AI insights, and multi-factor risk analysis into one decision surface.
See how we collapse hours of technical analysis and fundamental research into seconds.
Pick a symbol and timeframe. Instantly overlay advanced indicators on our interactive canvas.
AI spots patterns while integrating fundamental headlines, sentiment, and SEC filing context.
Review the tri-factor stack (Technical, Risk, Combined) for a clear directional recommendation.
Watch how to move from raw chart data to a synthesized multi-factor strategy in seconds.
Stop guessing if a breakout is real. Our system automatically identifies complex formations directly on the chart and assigns a historical reliability score.
Protect your downside with direction-aware risk modeling and Monte Carlo logic to produce dynamic risk levels and success probabilities.
Move from chart to strategy instantly. We synthesize technical analysis, sentiment, holdings, and risk into one definitive recommendation.
How FinMonkeys transforms your daily technical analysis.
Tailored technical workflows for every style of trading.
Validate your own manual analysis with AI pattern recognition and algorithmic conviction models before placing orders.
Learn charting through plain-English AI summaries that translate complex momentum indicators into actionable advice.
Monitor comprehensive risk scores, volatility percentiles, and reward/risk ratios via Monte Carlo logic before entering a trade.
Join thousands of traders replacing multiple tabs and disparate tools with one unified technical analysis workspace.
Read Stories →"Having pattern detection automatically overlay on my custom timeframes saves me easily two hours of manual prep work every morning."
"Our fund relies on the Monte Carlo risk logic embedded right next to the chart. The direction-aware volatility tracking prevents us from getting caught in false breakouts."
"The multi-factor recommendation stack is incredible. Finally, a tool that weighs my technical breakout against the fundamental sentiment score simultaneously."
"Having pattern detection automatically overlay on my custom timeframes saves me easily two hours of manual prep work every morning."
"I used to spend hours checking multiple platforms for charting and risk. Now it's all in one workspace."
— JAMES, DAY TRADER"The real-time technicals combined with AI insights give me a massive edge in live workflows."
— PRIYA, PORTFOLIO MANAGEROur platform handles U.S. equities, sourcing real-time data for symbols across the NYSE, NASDAQ, Cboe, and BATS exchanges.
Instead of just looking at price action, our engine synthesizes raw technical indicators, historical risk models via Monte Carlo simulation, and fundamental news sentiment to give a unified signal.
Yes. The platform supports live workflows with auto-refresh controls gated intelligently to monitor market-open limits and forming candles.
Absolutely. You don't need to manually draw trendlines. The AI continually scans the chart to flag over 40 standard formations, highlighting breakout potential.
Join thousands going from chart to strategy in seconds with FinMonkeys.
Free plan available. No credit card required.